Getting Started / User Interface Basics
User Interface Basics
This section introduces the key interface components in HASS Cloud.
File Menu
File Menu
Located in the top-left of the Header. It holds file-related actions, including file, properties, and global properties actions.Select the menu button to open File Menu as a drop-down list. Each option takes you to the related action, module, or dialog.
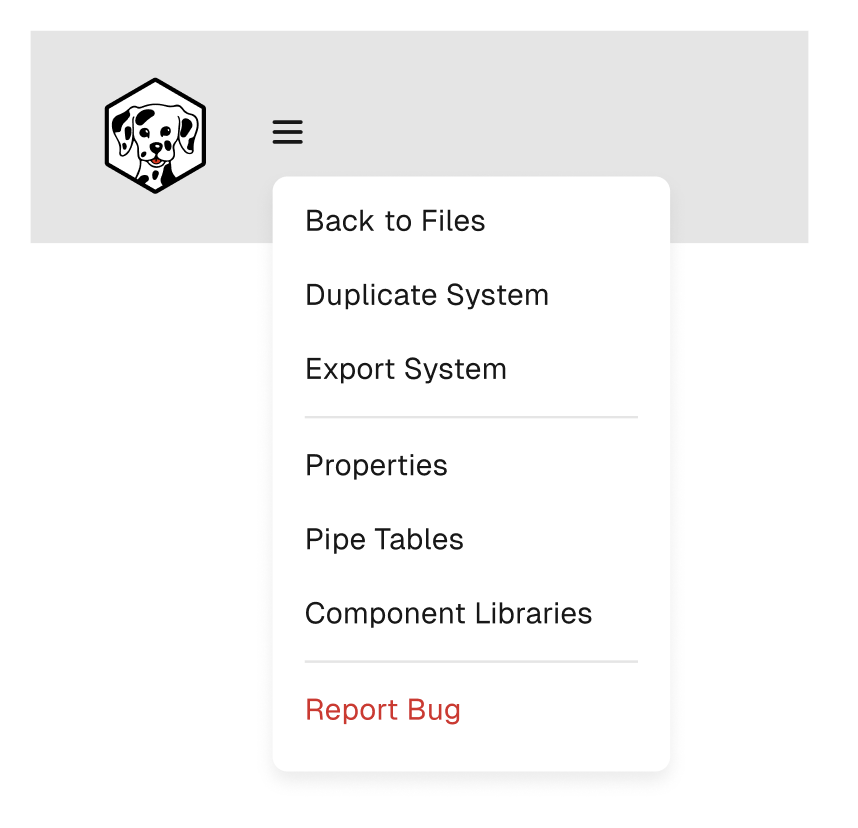
Back to Files
Closes the current project and returns to the file screen. See Project Overview for file and folder behavior.Duplicate System
Creates a duplicate of the current system and saves it in the same location as the original.Export System
Exports the current system.Properties
Opens the system properties screen where changes can be made to System Name, Description, Units, Pipe Table Book, and related settings. See Calculations -> Pipe Table for how these settings affect run behavior.Pipe Tables
Opens pipe table options to import, modify, or create global pipe tables.Component Libraries
Opens component libraries for global templates, including pumps, risers, and related components.Report Bug
Opens bug reporting for the HRS development team. Check Troubleshooting and Support first to quickly resolve known issues.Project Properties (Quick Access)
Project Properties (Quick Access)
Located in the Header, this component provides project-related properties including project name, type, client, selected pipe table, and configured diameter ranges.
Select the quick access panel to open project properties and update available fields.
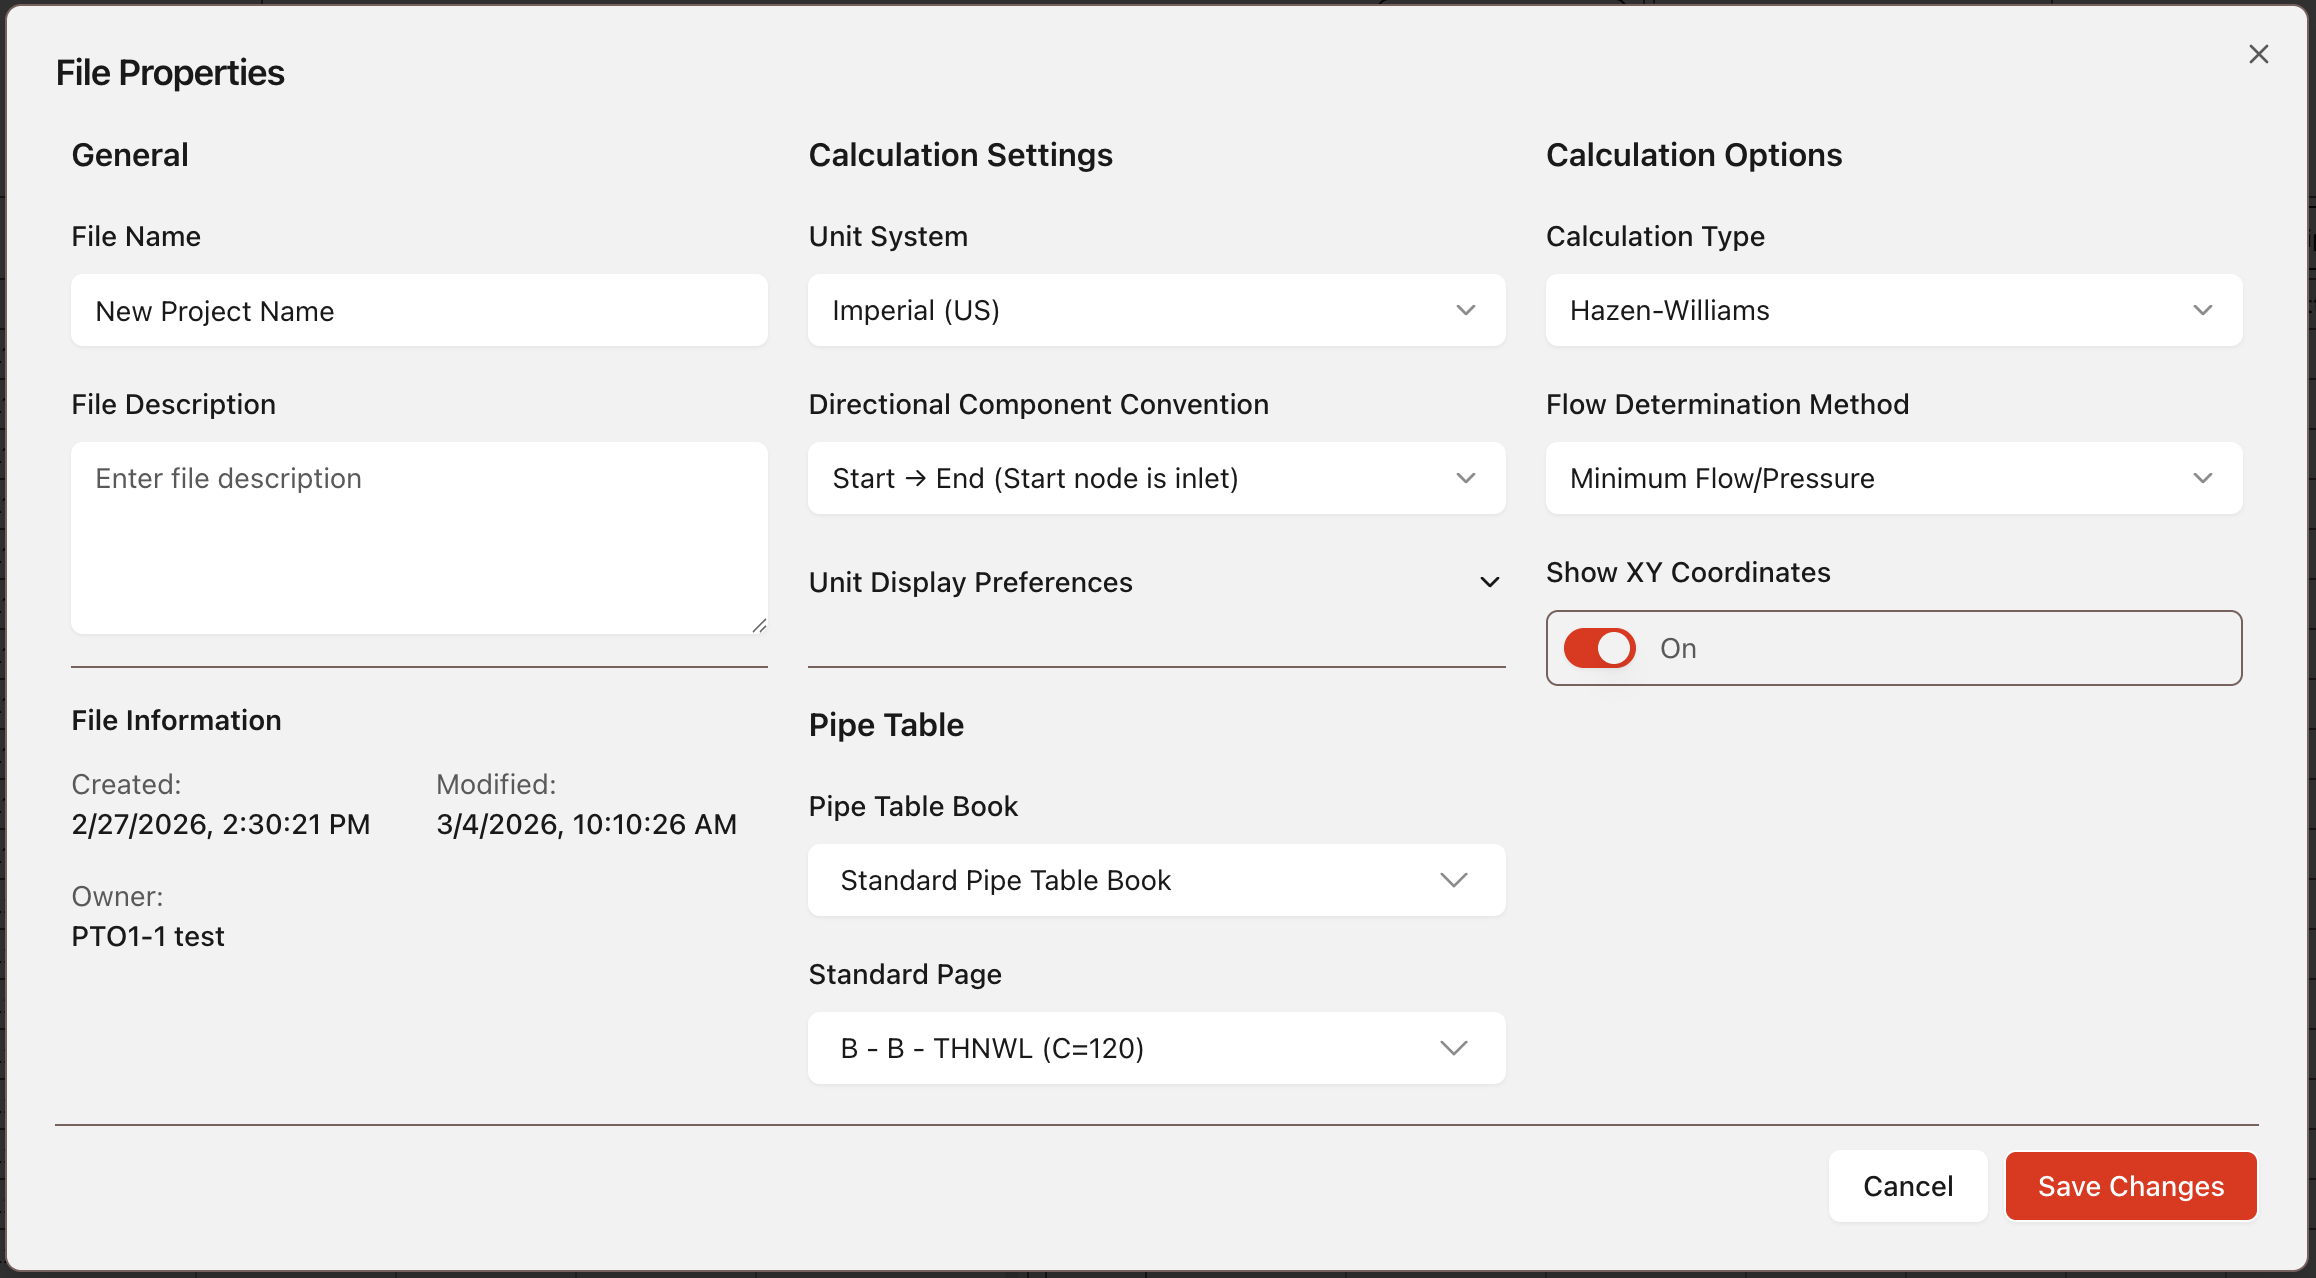
Editable Properties
File Name: File Name.
File Description: Description of file.
Pipe Table Selected: Select pipe table to be used. See Calculations -> Pipe Table.
Show XY Coordinates Toggle: Toggle for XY Coordinates column in spreadsheet.
Unit System: Choose between imperial and metric.
Unit Display Preferences: Choose exact units to be used for Length, Elevation, Flow Rate, Pressure, and Area.
Directional Convention: Pipe node directional entry preferences.
Report Page Size: Choose the size you would like your report printed out to.
Calculation Type: Choose between Hazen-Williams and Darcy-Weisbach.
Flow Determination Method: Choose between Density and Area, Minimum Flow/Pressure, Density and Area + Minimum Flow/Pressure, or Supply Side.
Non-Editable Properties
Type: Project type (Calc / Design).
Owner: Project owner, who created the project.
Created on: Project creation date.
Last modified: Most recent project update timestamp.
Toolbar
Toolbar
Located at the top of the project workspace, the Toolbar contains the main tools used to build and calculate a system in HASS Cloud.Toolbar buttons map to the main features of HASS Cloud.

Calculation
Define hydraulic calculation criteria and run calculations for the system. See Running a Calculation.Results
View calculation results and the related report, then print or export the report. See Resolving Calculation Errors for common run issues.Builders
Use automatic building tools for trees, grids, and complex systems. See Data Entry -> Builders.Utilities
Use tools for specialized values, including Equivalent K-factors and System Volume. See Data Entry -> Utilities.Find
Find and Replace tool to change all of a certain value to a new value.Pipe Tables
Open the global pipe table editor. See Calculations -> Pipe Table.Data Input Tables
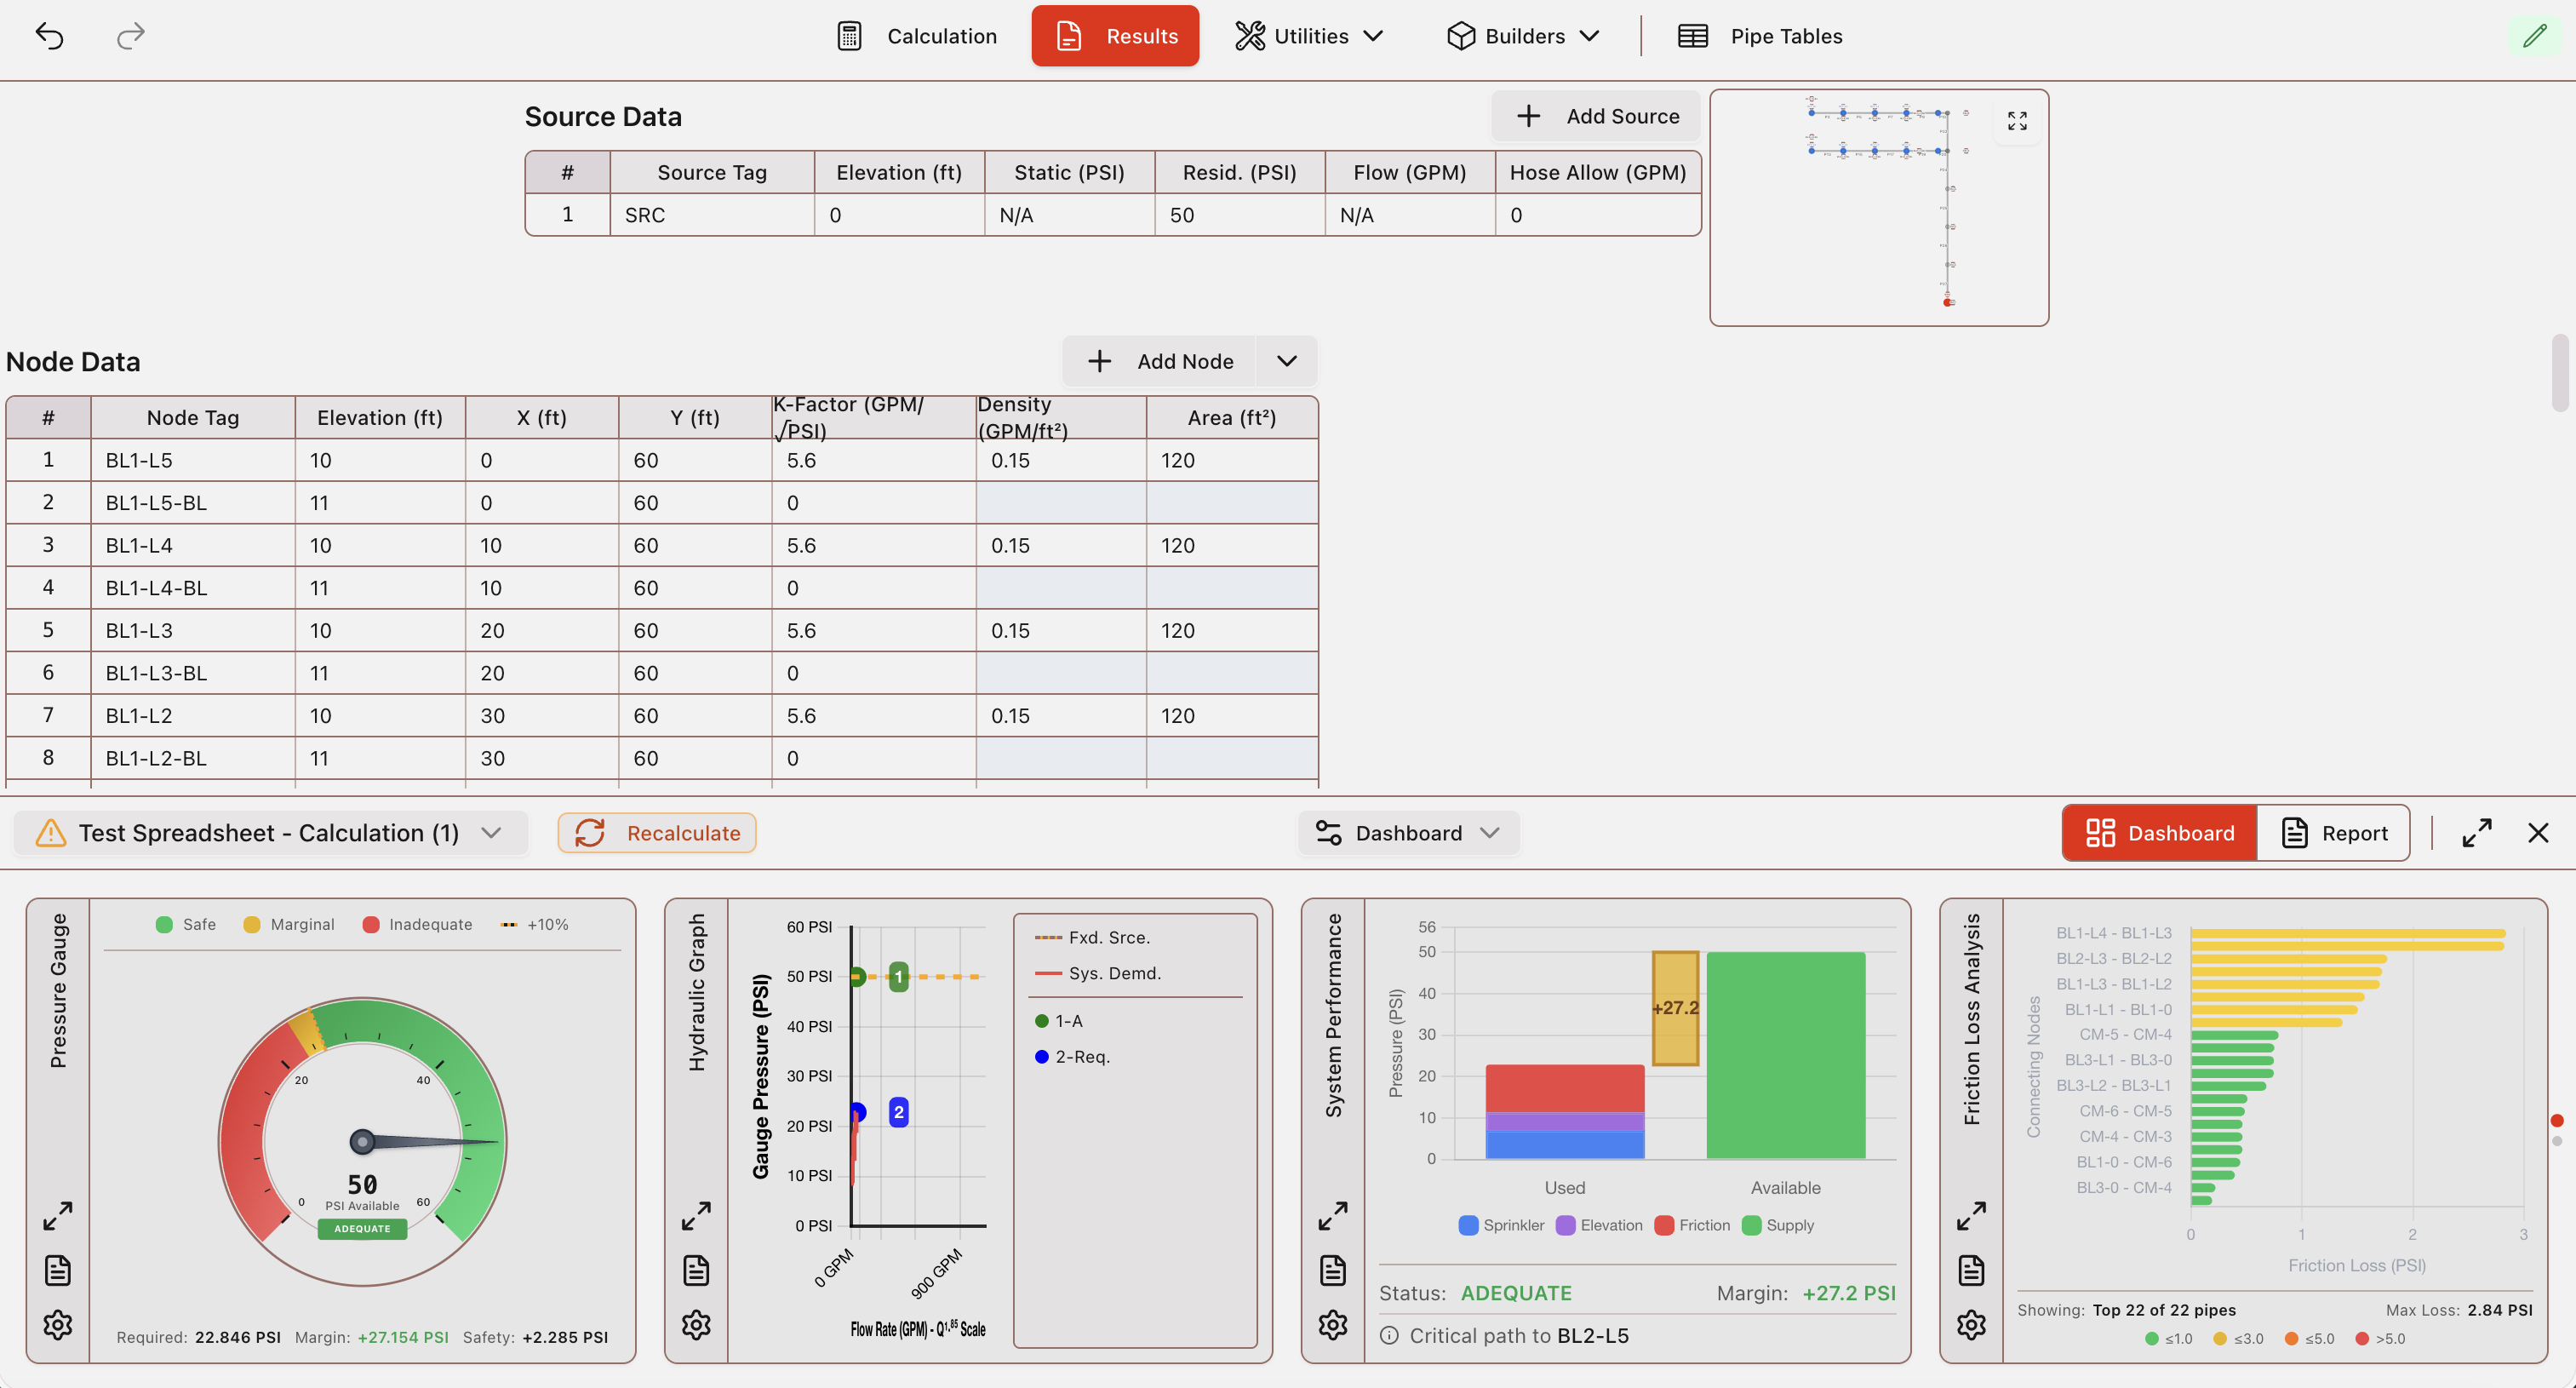
Data Input Tables
Three data input tables make up main area for system building in HASS Cloud. See Data Entry -> Data Input Tables for full table workflows.
Source Data
Input source data, including fixed and variable source types.Node Data
Input node data, including nodes, sprinklers, and hose streams.Pipe Data
Input pipe data, including normal pipes, pumps, PRV, and FPLD values.Results & Reports
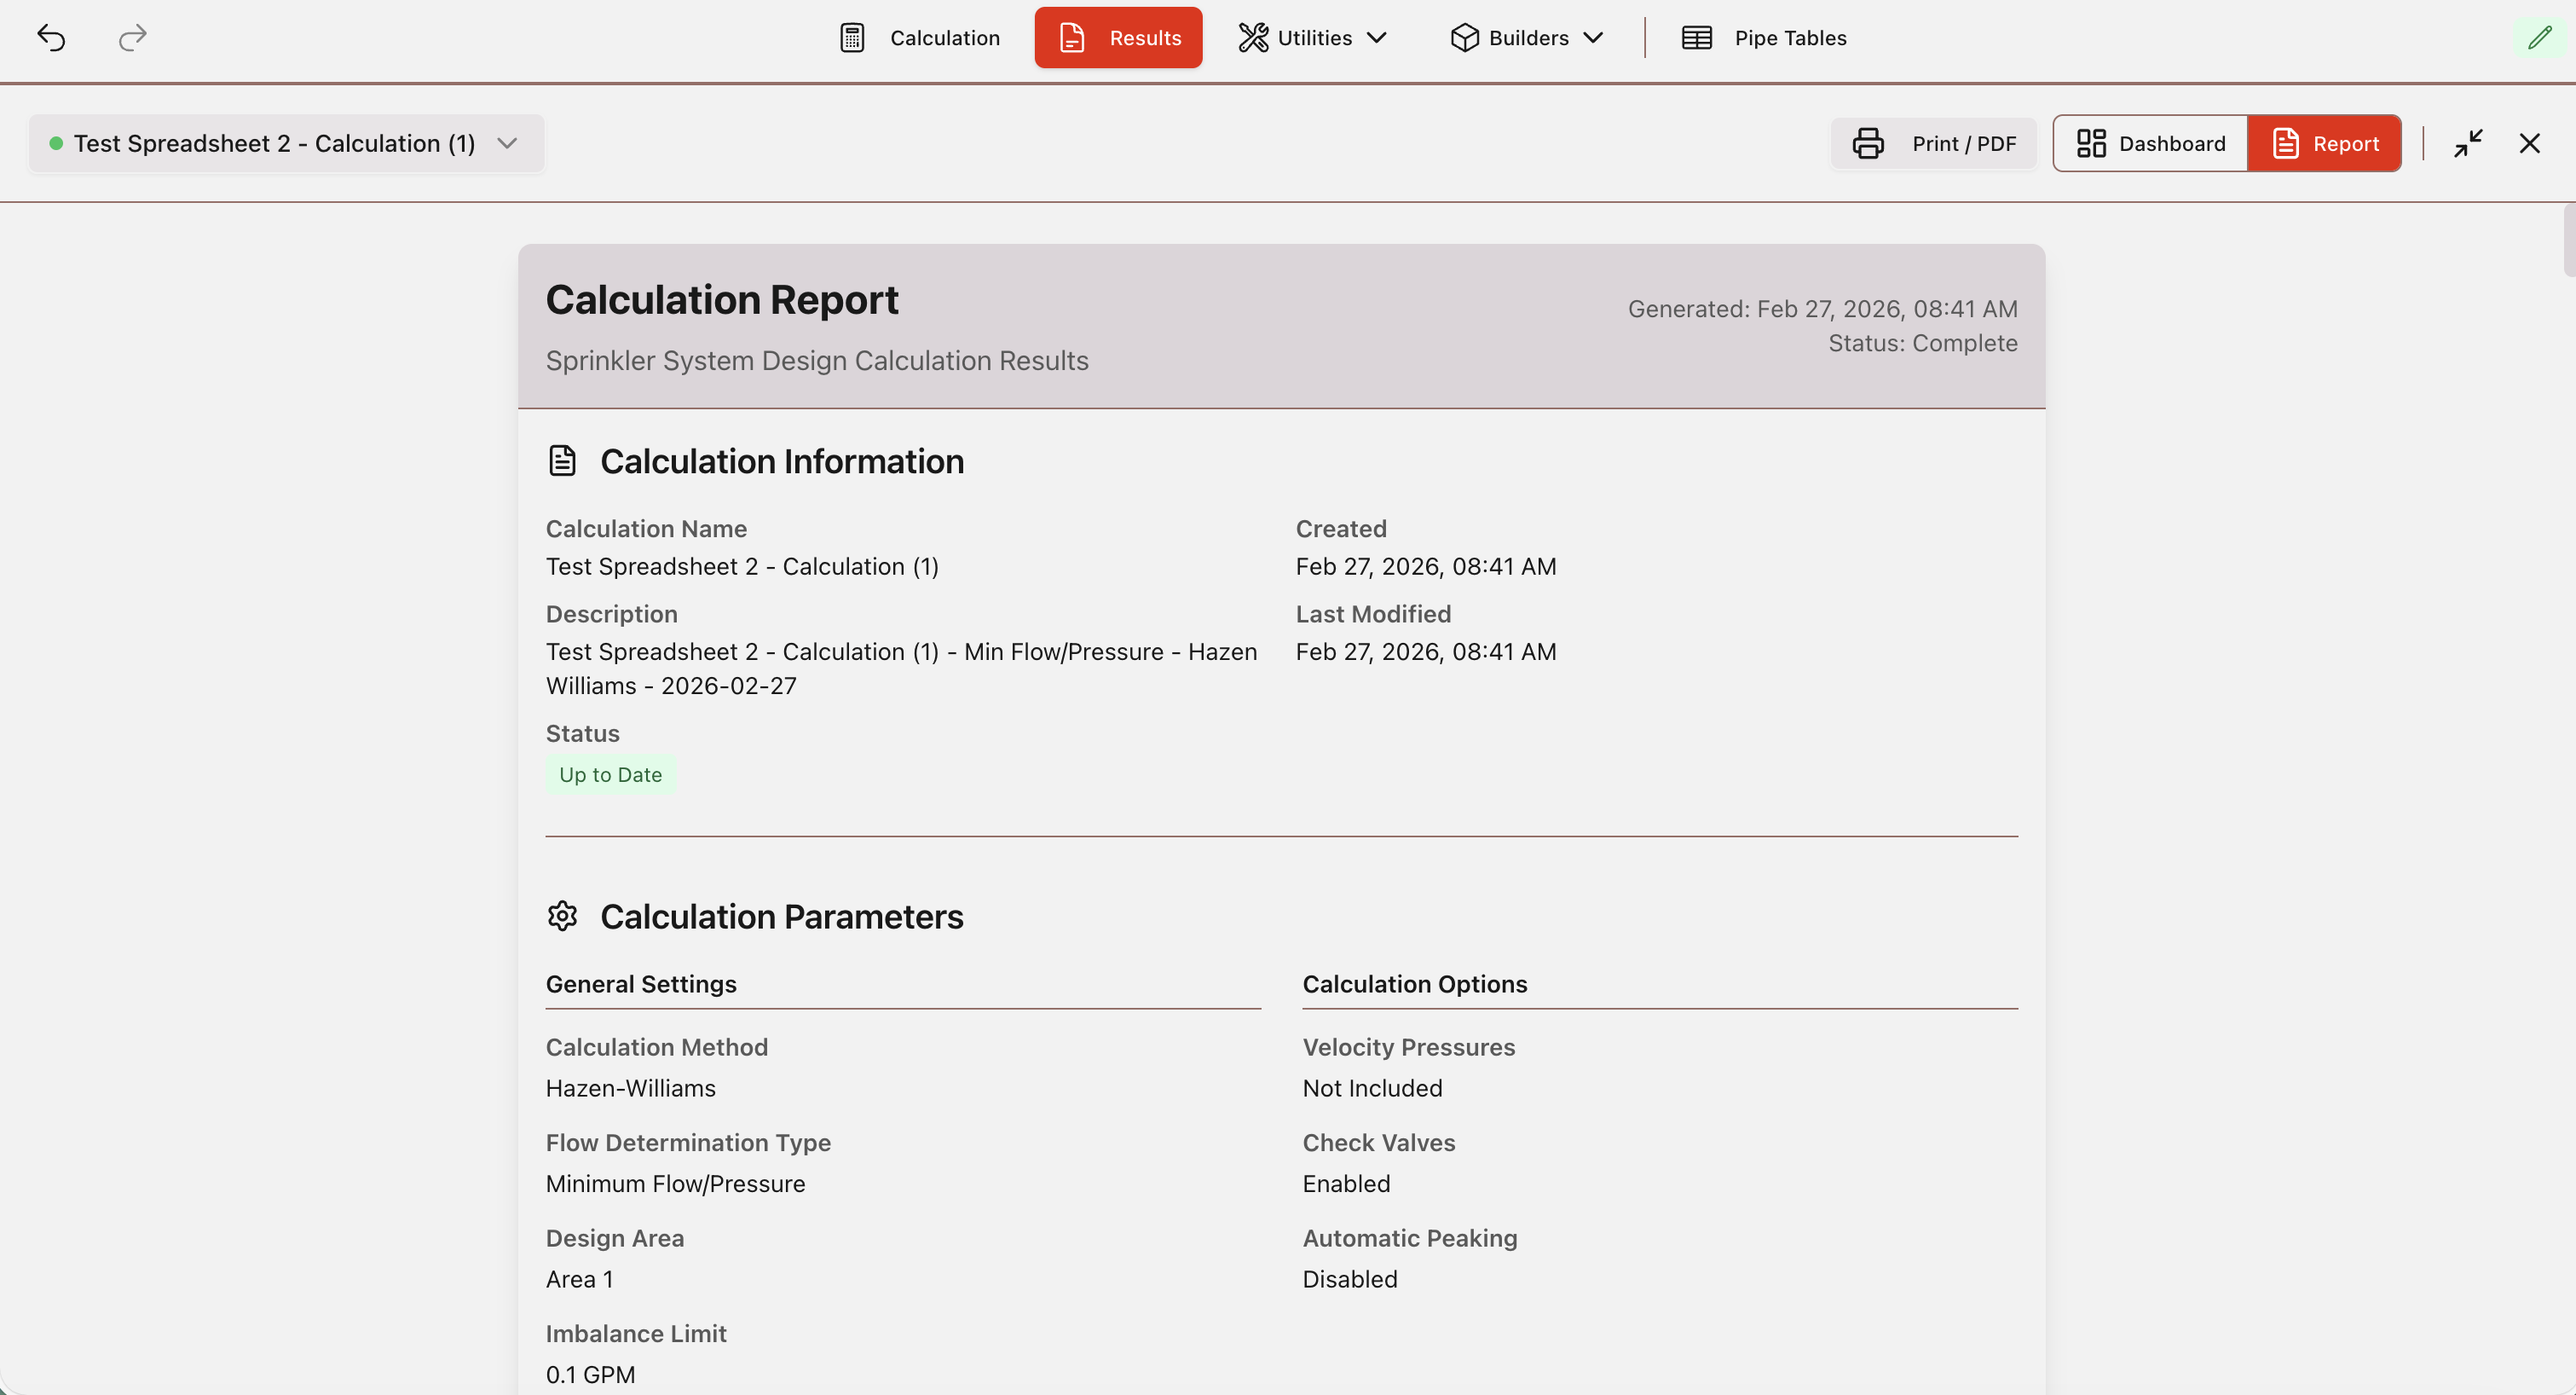
Results & Reports
Accessed from the Results area in the Toolbar, the Results Dashboard and report can be viewed, printed, and exported.Results Dashboard provides a quick view of key calculation outputs. The report is formatted for required submittal per NFPA-13 guidelines.
Results Dashboard
Dashboard quick view appears after a calculation and can stay visible while edits continue in data tables.Use Recalculate on the dashboard to refresh results after edits.
Dashboard view can be maximized to show all modules at once. Individual modules can also be maximized and configured with module-specific settings.
Report
Open the report from the Results Dashboard, then export to PDF or print. See Troubleshooting -> Errors & Warnings when report values indicate unresolved issues.